Lab v field data – how to monitor your Core Web Vitals

Core Web Vitals are becoming increasingly important for Google search rankings, and there are now a variety of tools available to help you measure them. This article considers some of the differences between these tools, and how publishers can make use of lab and field data to improve their Core Web Vitals.
Summary
- What are Core Web Vitals?
- Why Core Web Vitals matter
- Measuring Core Web Vitals – differences between lab and field data
- Which tools can you use to measure Core Web Vitals?
- Factors to consider when choosing a Core Web Vitals Monitoring tool
- Try Clickio Web Vitals Monitoring for free
What are Core Web Vitals?
In May 2020, Google introduced a new set of metrics called “Core Web Vitals.” These were designed to help web developers optimize their sites for high-quality real user experiences.
The current set of Core Web Vitals consists of three metrics: Largest Contentful Paint (LCP), Interaction to Next Paint (INP), and Cumulative Layout Shift (CLS), with each of them focusing on a specific aspect of the user experience.
1. Largest Contentful Paint (LCP) measures loading performance – in other words, how fast your site appears on the screen
2. Cumulative Layout Shift (CLS) quantifies visual stability – essentially the amount of unexpected or how much your content moves
3. Interaction to Next Paint (INP) measures how quickly a website responds to user interactions like clicks or key presses.
You can find out more in this previous blog post.
Why Core Web Vitals matter
Understanding your Core Web Vitals could help you to improve your site performance, enhance user experience and boost your search rankings.
Since June 2021, Google has used Core Web Vitals as part of its search algorithms, so if you’re not compliant with all of the measures, you could see your site drop in search rankings, leading to a reduction in traffic.
But that’s not the only reason to improve your Core Web Vitals. The idea behind them is to ensure that websites offer a good page experience, and if you’re doing that, then you’re more likely to see satisfied visitors, who want to spend longer on your site, view more content and return more frequently. Ultimately, this should lead to an increase in your revenues, as users view and interact with more ads.
In fact, Google cites several examples of companies that have benefited significantly from improving elements of their Core Web Vitals.
- Vodafone (Italy) improved LCP by 31% to achieve 8% more sales.
- iCook improved CLS by 15% to achieve 10% more ad revenue.
- Yahoo! Japan fixed CLS which led to a 98% reduction in poor pages and a 15% uplift in page views per session.
- Tokopedia improved LCP by 55% and saw 23% better average session duration.
What’s more, Core Web Vitals look likely to increase in importance even more over the coming months, as they begin to have an impact on desktop as well as mobile rankings.
Measuring Core Web Vitals – differences between lab and field data
So how can we get the most useful insight about user experience metrics? According to Google, there are two resources to learn how users are experiencing a website.
Those two resources are lab data and field data, with the latter also known as Real User Monitoring (RUM) data.
- Lab data is collected within a controlled environment with predefined device and network settings. As such, it provides reproducible results with immediate feedback, and can be good for debugging.
- Field data allows you to understand what real-world users are actually experiencing on your site, which can be dependent on a variety of factors such as their geographic location, device and network conditions.
Let’s consider an example to see the different uses that lab data and field data have on real-world data for a page’s Largest Contentful Paint (LCP).
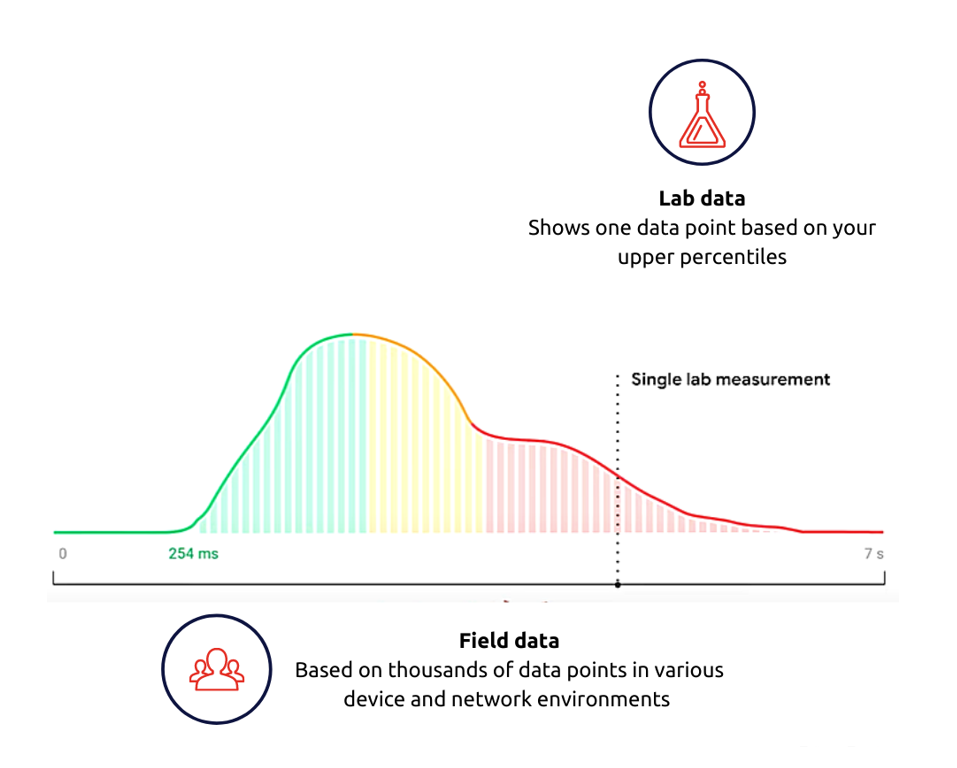
When you measure the Core Web Vitals on your page using lab data and get an LCP value, for example, it is a single data point collected in real-time for you, calibrated to represent a user in your upper percentiles. What this allows you to do is use a single set of values as representative of your user’s experience on your page so you can dive deep and debug against that.
Field data, on the other hand, is recorded from real users on their real devices. Every time your users load your page, it adds a single data point to this set. Because of this, a single field metric represents all of your users.
While both can be useful, field data is crucial since it is what Google utilizes for its page experience rankings.
Which tools can you use to measure Core Web Vitals?
There are several tools available from Google to help you to measure your Core Web Vitals performance score, using a mix of lab and field data. Clickio also offers a Web Vitals Monitoring service, based on real-time, real-user data. You can see these compared in the table below.
| CWV measurements Tools | Data type | Data frequency | Data Levels |
|---|---|---|---|
| Clickio Web Vitals Monitoring | Field data | Real-Time Field Data | Site Level and Page Level |
| Clickio Check Core Web Vitals | Field data | Based on CrUX report | Site Level |
| PageSpeed Insights | Lab and Field data | Shows 28-day average | Site Level and Page Level |
| Chrome User Experience Report (CrUX) | Field data | Historical data updated monthly | Site Level |
| Google Search Console | Field data | Shows 28-day average | Page Level |
| Chrome Developer Tools | Lab data | Only for the user currently browsing | Page Level |
| Lighthouse | Lab data | Only for the user currently browsing | Page Level |
| Web Vitals Chrome Extension | Field data | Only for the user currently browsing | Page Level |
Factors to consider when choosing a Core Web Vitals Monitoring tool
All of the above tools can be helpful for measuring your Core Web Vitals, but there are several factors you might want to consider when choosing one.
1. Does it provide real-user data?
As already discussed, real-user (field) data is necessary if you want to see scores based on what your users are actually experiencing on your site in real-world conditions. As Google itself says:
“The data provided by Chrome User Experience Report offers a quick way to assess the performance of sites, but it does not provide the detailed, per-pageview telemetry that is often necessary to accurately diagnose, monitor, and quickly react to regressions.
As a result, we strongly recommend that sites set up their own real-user monitoring.”
2. How recent is the data?
It’s important to know how recent the data in your Core Web Vitals report is so you can take action accordingly. For example, the Chrome User Experience Report uses historical data which is updated monthly. So if your Core Web Vitals suddenly drop, it could be some time before you’re able to see this in the report. Worse still, if you make changes to correct any issues, you’ll have to wait a month to see if they’re having any impact. Only real-time data allows you to act quickly to minimize the impact of any drop in your Core Web Vitals.
3. How much detail do you get?
Some tools only show an overall score for your site, so you can’t see how this differs across individual pages. Choosing a tool with page-level detail will help you amend any individual pages that are dragging down your score. Similarly, tools such as Clickio’s also allow you to filter by other factors such as device type and browser, so you can more easily identify the source of any problems.
Try Clickio Web Vitals Monitoring for free
Based on real-time, real-user data, Clickio Web Vitals Monitoring makes it easy to accurately measure your Core Web Vitals, and drill down into the detail of your results. It also has the option to set up automated alerts, so you receive an email notification whenever your scores drop below a certain level.
The basic version of the service is available free of charge for any website, so why not give it a go?
If you’re already using the Clickio Platform, just go to the Web Vitals Monitoring tab to get set up.
If you’re not already registered, click here to sign up now.